Check Model Health
Overview
Check Model Health runs a read-only audit of the active model. On launch it scans the whole document behind a progress window, then opens a dashboard with two panels: Model Info (project name, number, client, and address, plus file name, model size, Revit version, and worksharing status) and Model Overview, a grid of counted totals — each with its used/unused split — for views, legends, schedules, sheets, families and family types, model groups, in-place elements, assemblies, worksets, view templates, filters, design options, scope boxes, phases, total elements, warnings, and links & imports. A Diagnostics panel summarises the two things that most often need triage: how serious the model’s warnings are, and what is weighing around it. The heavier tiles are clickable to open detailed breakdowns, and the full report exports to a text file that carries your company name, accent colour, and logo once you have set them in User Profile.
Model Info
Identity and file facts: project name, number, client, and address, plus file name, model size, Revit version, and worksharing status, including the central path when the model is workshared.
Model Overview
Counted totals with used/unused splits for views, legends, schedules, sheets, families and family types, model groups, in-place elements, assemblies, worksets, view templates, filters, design options, scope boxes, phases, total elements, warnings, and links & imports.
Breakdowns (click a tile)
- Views — every view broken down by type (floor plans, sections, and so on) with totals and on-sheet vs. unused counts.
- Schedules — schedule groups (schedules, material takeoffs, sheet lists) with on-sheet vs. unused counts.
- Elements — element counts per category.
- Links & Imports — Revit links, CAD links, images, PDFs, point clouds, and coordination models.
- Warnings — every Revit warning, expandable to its affected elements, with Highlight in the model and Refresh after fixing.
Diagnostics
Two bars that answer "where do I start?". The warnings bar classifies each warning against a curated catalogue and splits the total into Critical, Important, Noise, and Uncatalogued, so a model with two thousand warnings tells you how many actually matter. Warnings the catalogue does not yet know appear as Uncatalogued rather than being guessed at. The Model Size bar breaks down what sits around the model: links and images measured from their real bytes on disk, and family export weight, which stays at zero until you run a Deep Scan.
How to use
- In the B45 Labs | Coordination tab, open the QA/QC panel and click Check Model Health.
- A progress window scans the whole model; the dashboard then opens with the Model Info and Model Overview panels populated.
- Read the Model Overview tiles — each shows a total plus its used/unused split (views on sheets vs. unused views, unused families, in-place elements, and so on). The Warnings tile turns red when the model has any.
- Read the Diagnostics panel: the warnings bar splits the model’s warnings into Critical, Important, Noise, and Uncatalogued, and the Model Size bar shows what is contributing weight — links, images, and family export weight.
- Click a tile — Views, Schedules, Elements, Links & Imports, or Warnings — to open its detailed breakdown.
- In the Warnings breakdown, expand a warning to see the elements it affects, highlight them in the model, and refresh the list after you fix them.
- Click Export to save the full report as a text file, or open the detailed report to read it in place.
Screenshots
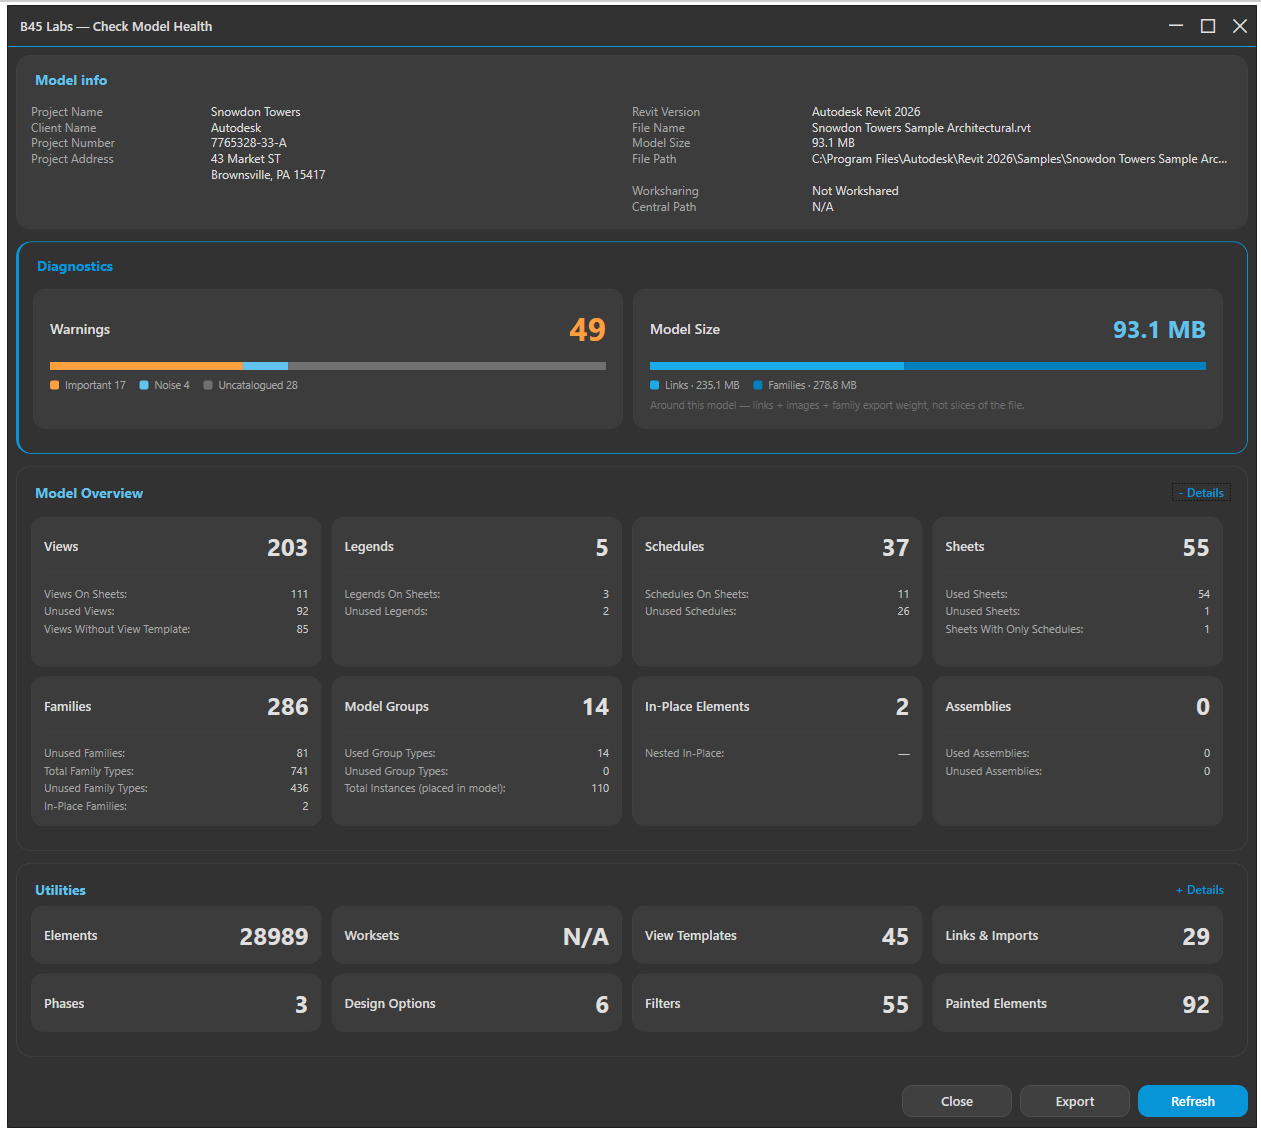
Dashboard: Model Info and Model Overview
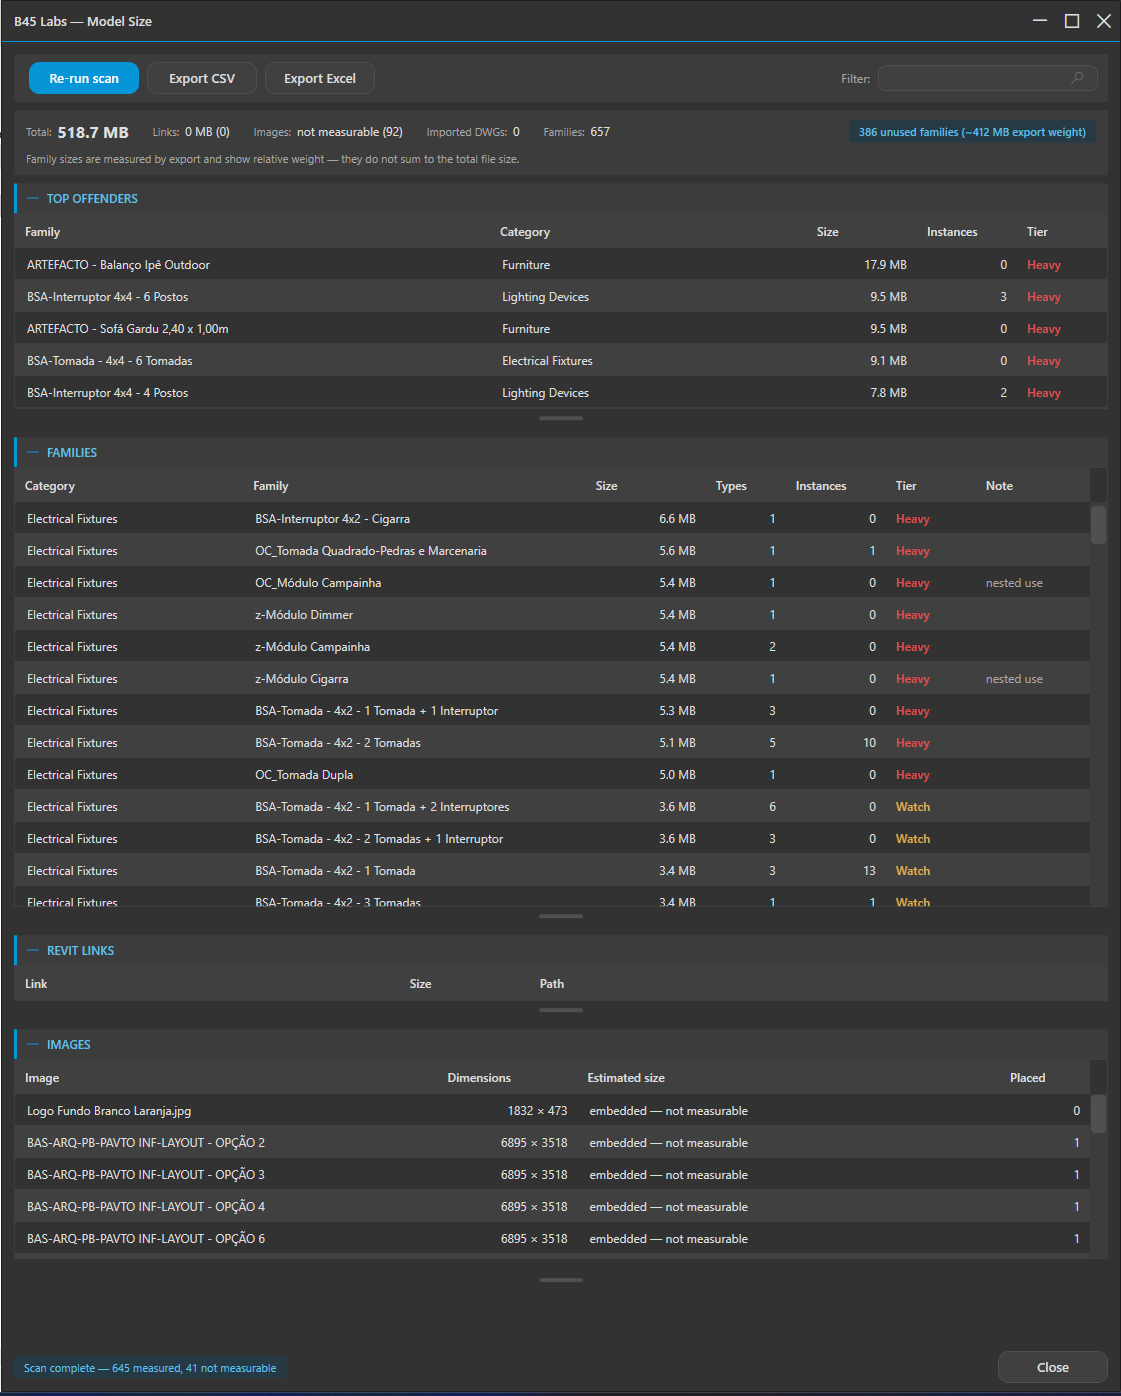
Model Size: largest contributors breakdown
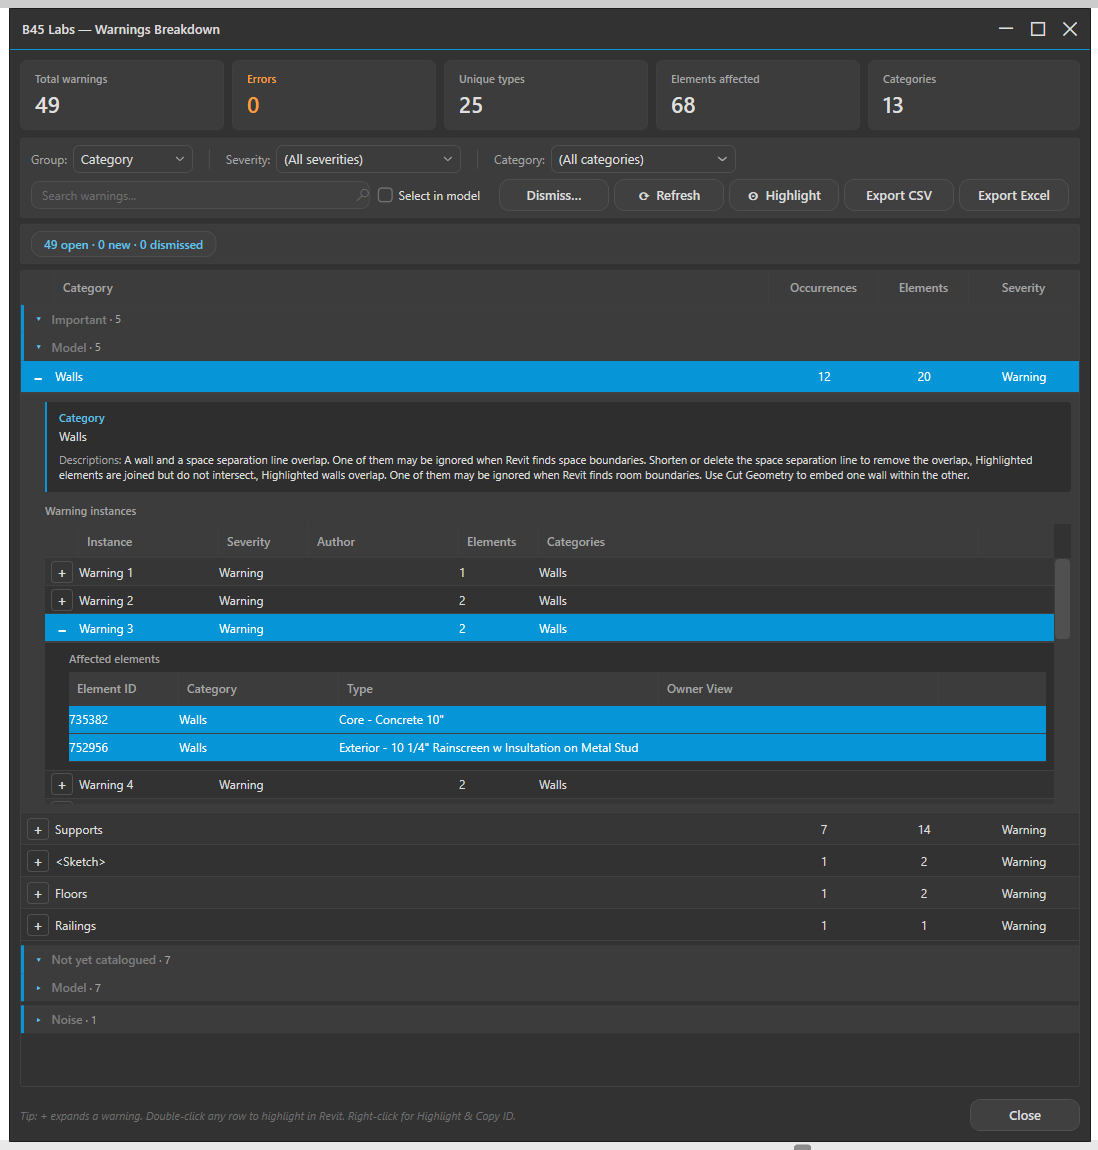
Warnings breakdown with severity triage
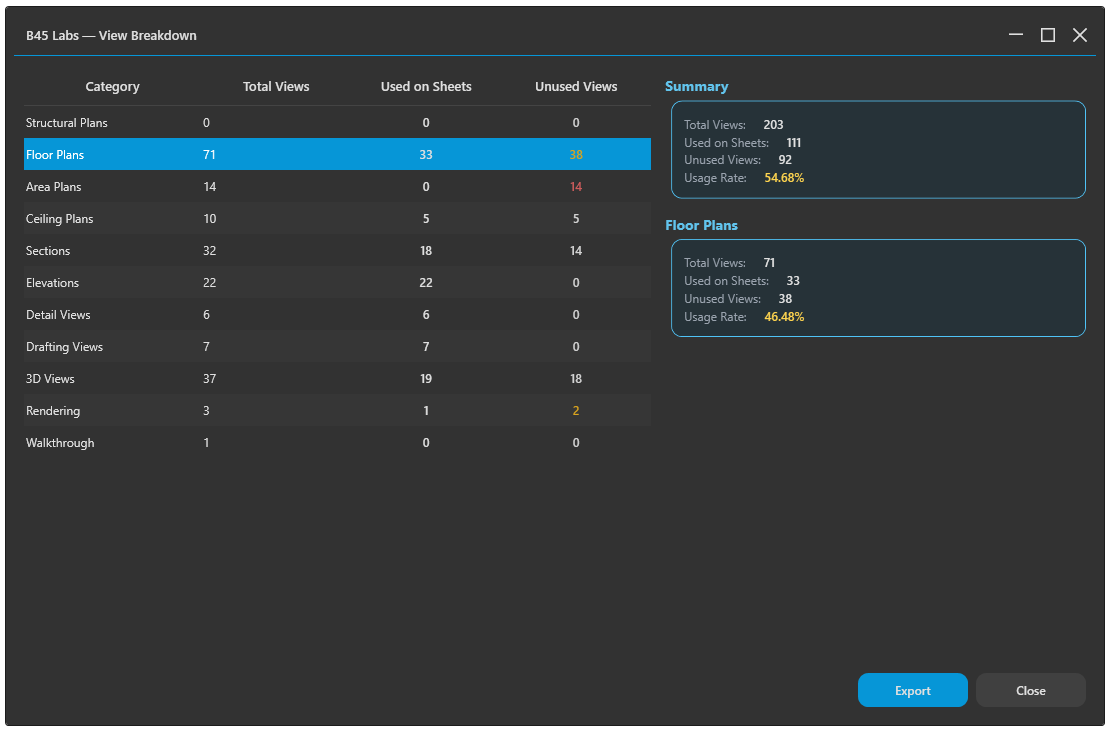
View Breakdown
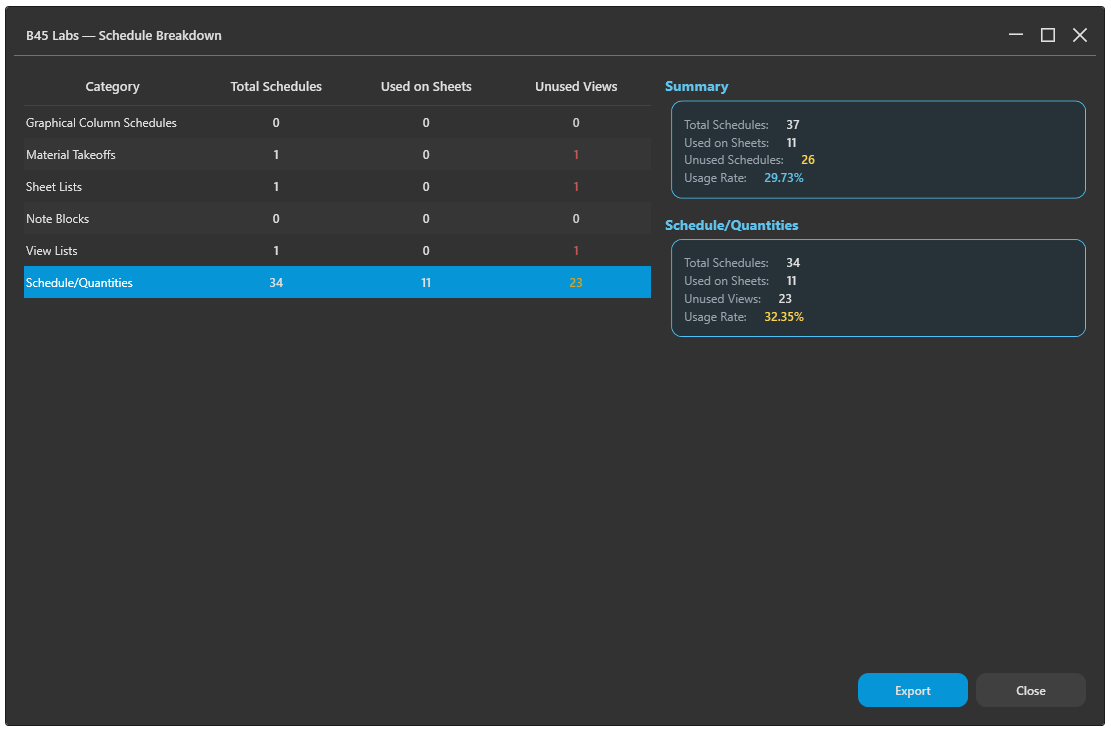
Schedule Breakdown
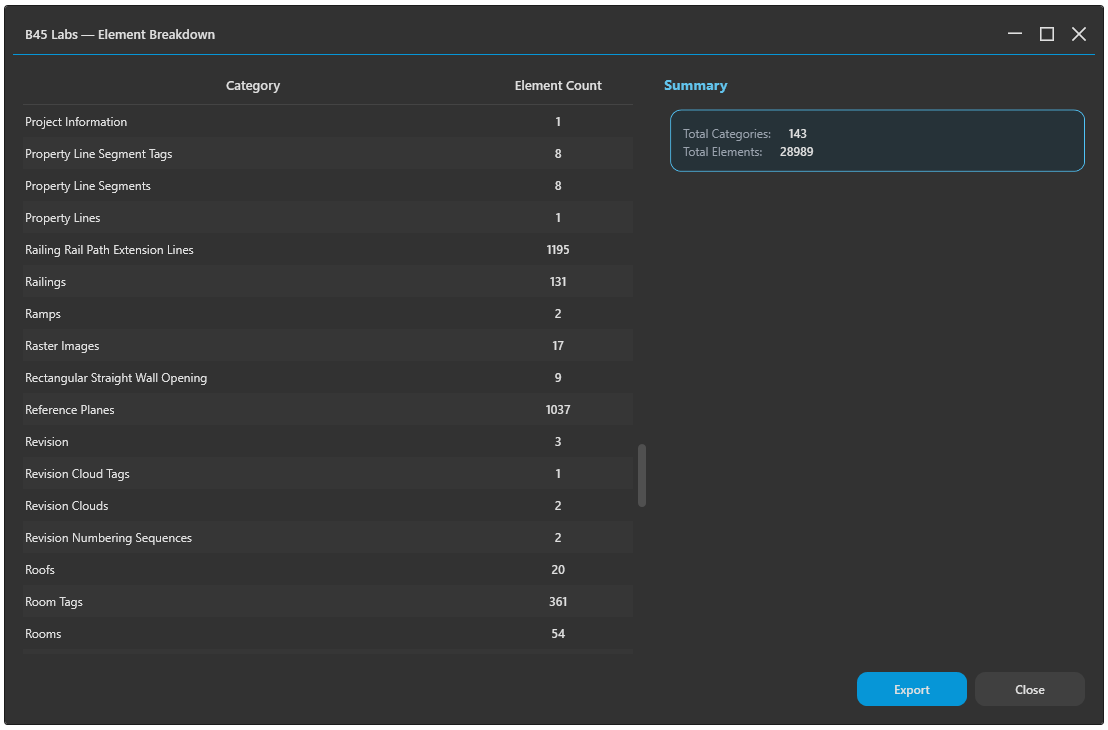
Element Breakdown
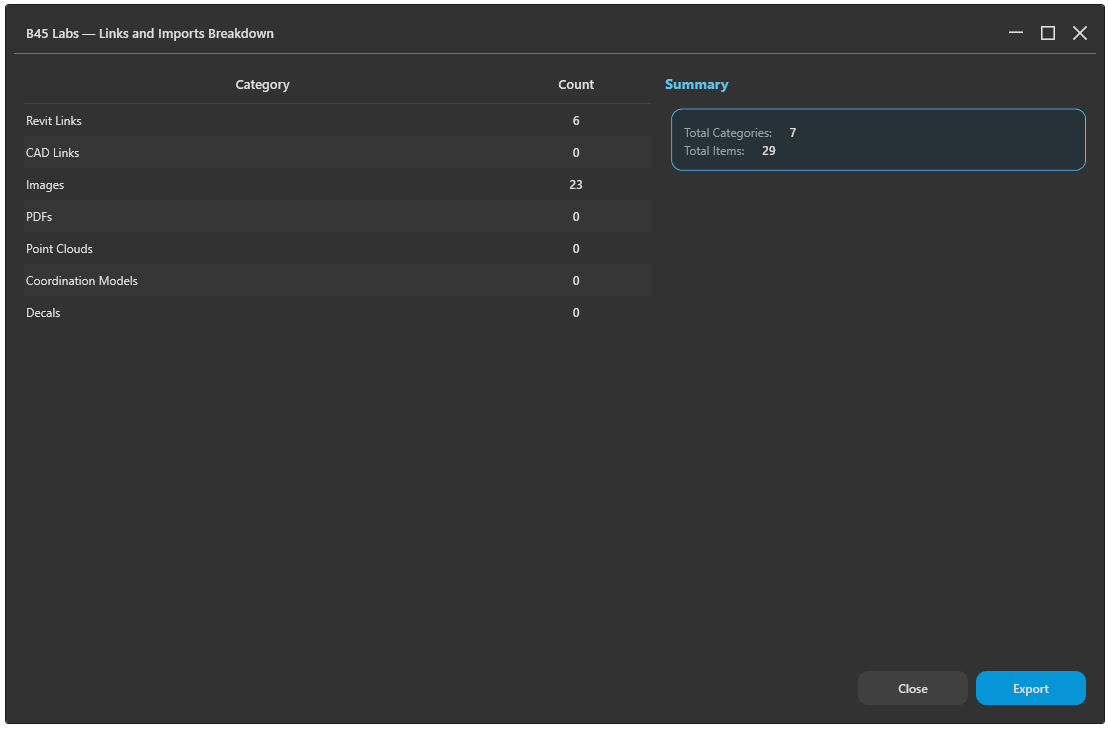
Links & Imports Breakdown
Tips & Notes
- Run it before a delivery or coordination milestone: unused views, families, and templates plus the warning count are the fastest signals of model bloat.
- The Warnings breakdown is the only interactive panel — use Highlight to jump to the offending elements, fix them, then Refresh to confirm the count dropped without relaunching.
- Any warning turns the Warnings tile red while zero keeps it neutral, so it doubles as an at-a-glance health light.
- In-place elements and unused loaded families are the two counts worth driving toward zero for performance and file size.
- Set your company name, accent colour, and logo once in User Profile and every report this command exports carries them, along with the reports from Check Coordinates, Check Parameters, Export Worksets, Model Progress, Clash Report Converter, and Model Report Card.
Limitations
- Read-only — it reports on the model but never modifies it.
- Audits the host model only; loaded Revit links are counted but their contents are not scanned.
- The dashboard is a snapshot taken at launch — re-run the command to re-scan after changes (the Warnings breakdown has its own refresh).
- The Model Size bar measures what surrounds the model, not slices of the .rvt file. Links and images are external files, so the bar can add up to more than the host model weighs on disk.