Clash Map
Overview
Clash Map turns a Navisworks clash report into 3D markers inside your model. Point it at the exported Excel report, pick a phase, and choose which clash statuses to place; the tool reads each clash's coordinates, converts them from the report's export unit, corrects for True North, and drops a Clash_Sphere family instance at every conflict point — typed (and colored) by status. It then builds or refreshes a filtered schedule of the placed spheres and arranges the 3D view and that schedule side by side, so you can review coordination issues visually and as a list.
Supported report formats
Clash Map auto-detects two layouts: the native Navisworks HTML/Excel export (header around row 8, coordinates in a single Clash Point column) and the B45 Clash Report Converter output (separate X/Y/Z columns). It also reads the coordinate unit from the report's Tolerance cell (m / ft / in), so spheres land in the right place regardless of the export unit.
How spheres are typed by status
Each sphere's type is chosen from the clash Status. The Clash_Sphere family must contain types whose names match your statuses (for example New, Active, Reviewed, Approved, Resolved) — matched by name, so a type like "Approved Clash" still matches the status "Approved". Statuses with no matching type are skipped.
The Clash Map schedule
A Generic Models schedule named "B45 Labs - Clash Map Schedule" is created or updated, filtered to the Clash_Sphere family. Its visible columns are Clash Report (the report name), Clash Name (the clash's Mark), and Status (the sphere type), sorted by report, with a Total Clashes grand total.
How to use
- In the B45 Labs | Coordination tab, open the Clash Analysis panel and click Clash Map.
- Click Browse and select the clash report (.xlsx exported from Navisworks). A preview grid of the report loads automatically.
- Select the project phase the spheres should be created in.
- In the status list, tick the clash statuses to place — the list is built from the Status values actually found in your file, plus All.
- Click Run. A progress window tracks each sphere as it is placed.
- When it finishes, the dedicated 3D view and the Clash Map schedule open tiled side by side; use Resize Clash Spheres afterward to tune sphere size.
Screenshots
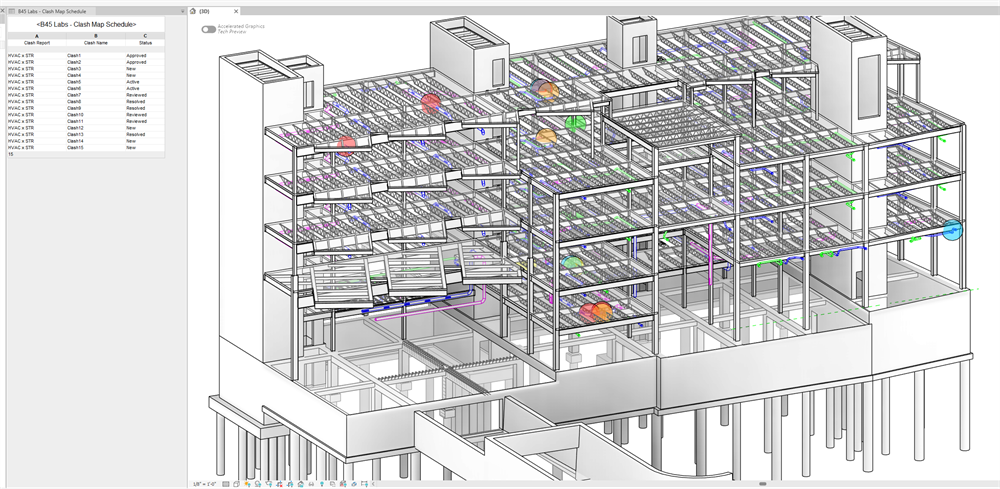
3D view with colored clash spheres at every intersection point
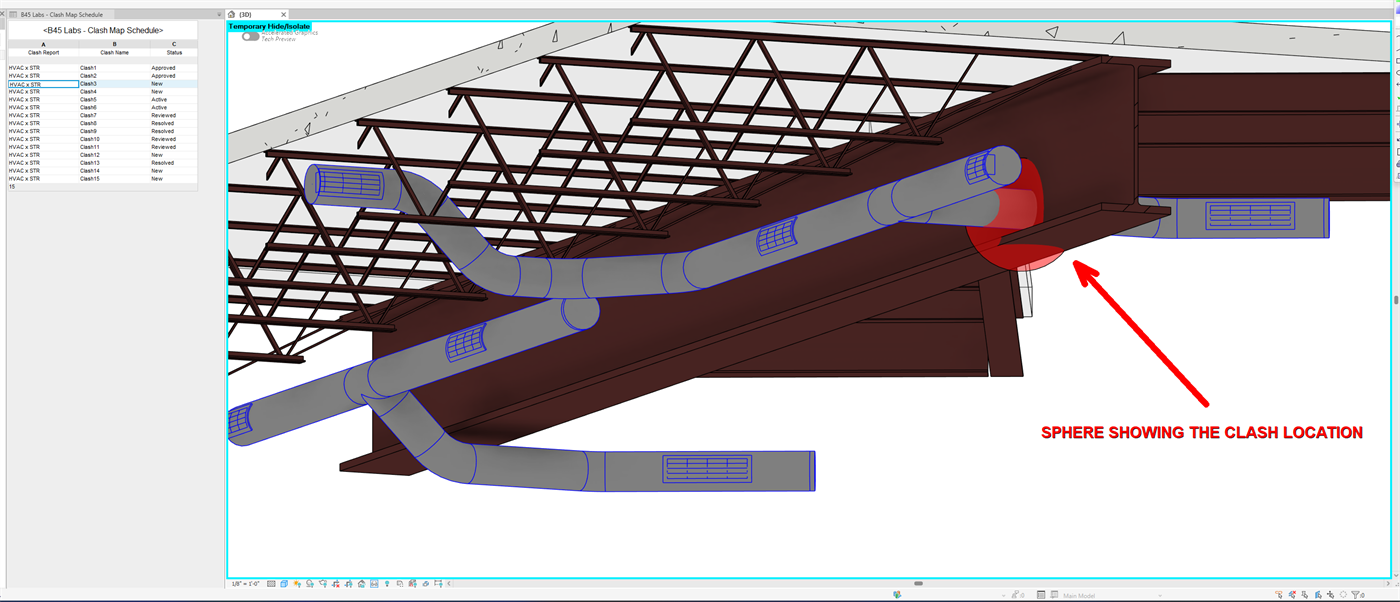
Clash detail: a single sphere reviewed in model context
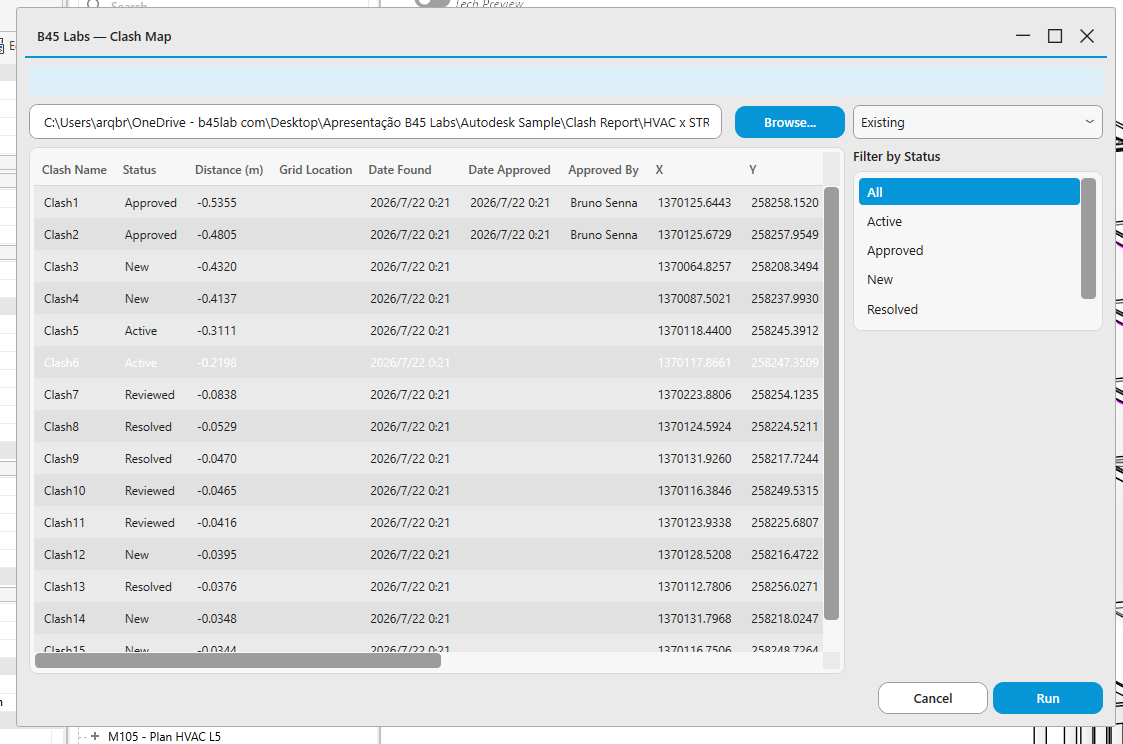
Clash Map results window with the placed-clash schedule
Tips & Notes
- Start with the New and Active statuses to focus on clashes that still need action, then re-run for the rest.
- Re-running reuses the same 3D view and schedule and re-applies their settings, so you can iterate on a report without piling up duplicate views.
- The Clash_Sphere family loads automatically if it is not already in the model — you only need the report file.
- True North correction is applied by default, so a report exported in shared/survey coordinates lands in Revit project coordinates.
Limitations
- The report must be a Navisworks-style .xlsx with recognizable Clash Name and Status columns, plus either a Clash Point column or separate X/Y/Z columns.
- Spheres are placed in 3D model space, not on sheets; a clash whose status has no matching Clash_Sphere type is skipped.
- Placement writes to the model, so read-only documents are rejected up front.